The Oil & Gas sector has ran into steep losses as Saudi Arabia has announced an increase in production last week. For a brief, yet very complete article on the incentives of involved parties please click here, a great post by Vitaliy Katsenelson. Naturally, while most companies in the sector feel the pressure of lower retail prices, some others receive a short term benefit while being able to adjust in the mid-term due to low cash constraints and leverage. In our view, one of those companies is Valero (VLO).
VLO is the largest global independent refiner and the largest renewable fuels producer in North America. It operates in three segments: Refining (~96% of revenues), Ethanol (~1% of revenues) and Renewable Diesel (~3% of revenues). With 4Q19 data, VLO has 15 refineries for a 3.15 million barrels per day capacity and logistic assets that include 3,100 miles of active pipelines, 130 million barrels of storage and over 50 docks; its renewable diesel operations is expanding its capacity to 675 million gallons per year while the ethanol segment has 14 plants for a capacity of 1.73 billion gallons per year.
In our view, the market is pricing a reduction on the two main components of revenues: price and quantity. On one side, we have lower oil prices, which imply lower retail prices for refined products, and we also have coronavirus halting economic activity, creating a lower demand for refined goods. Now, before even daring to answer if VLO benefits from lower oil prices or not, we would like to address the most important question in these situations: Is VLO likely to survive a liquidity crunch? To answer this question we look at contractual obligations, debt maturities and derivatives exposure and contrast it against operating cash flow.
Contractual obligations
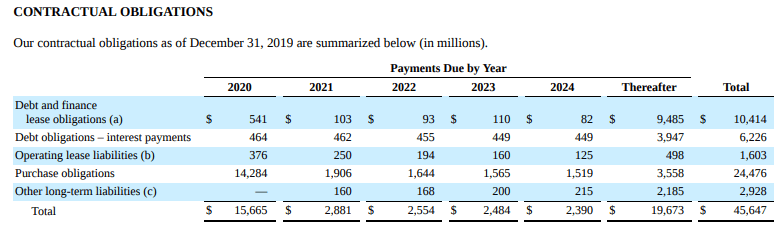
Going into the annual report, we find out that VLO’s contractual obligations are of around $15.7B for 2020. Out of the total amount, 91% comes from Purchase Obligations, which are defined as follows: “A purchase obligation is an enforceable and legally binding agreement to purchase goods or services that specifies significant terms, including i) fixed or minimum quantities to be purchased; ii) fixed, minimum, or variable price provisions, and iii) the approximate timing of the transaction.”
While we could argue that these obligations are likely to come down in hand with oil’s market prices, it is our opinion that it best to assume no changes to these requirements to avoid any negative surprises. The rest of the items are debt and finace lease obligations, interest payments, operating leases liabilities and other long-term liabilities.
Debt Maturities
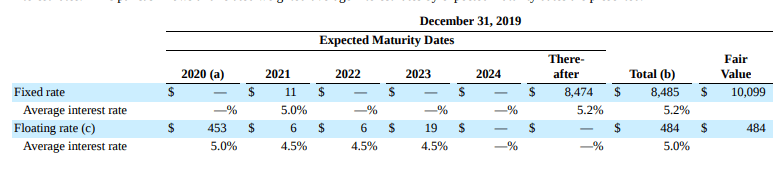
VLO has a a combination of fixed and variable rate financing through a bullet structure, mostly focused on principal repayments after 2024. For 2020, debt repayments should be around $453 M.
Derivatives exposure
Valero used cash flow and economic hedges to carry out its operations. As of December 31, 2019, the company’s notional amounts are slightly tilted to a net short position in crude oil and renewable diesel, while being net long in corn. Without being a make-or-break item, we believe this hedging component should provide slight gains due to the drop in oil prices.

Cash requirements for the company in 2020 therefore include:
- Contractual obligations of $15,665 M
- Debt maturities of $453 M
which total $16,118 M.
Now, looking at VLO’s liquidity sources, we can see:
- Cash and equivalents of $2,473 M, which excludes $110 M used for VIEs (variable interest entities)
- Receivables of $8,904 M at 70% = $6,233 M
- Inventories of $7,013 at 60% = $4,208 M
- Prepaid expenses $469 M
- Borrowing capacity in revolver facilities of i) $3,966 M from Valero revolver, ii) $112 M from Canadian revolver, and iii) $50 M of a letter of credit facility. Please note we are excluding $1,200 M from an accounts receivable sales facility to be conservative. The total of these liquidity sources is $17,511 or 1.08x the total liquidity needs in 2020, with some leeway due to reduced inventories, receivables and the accounts receivable sales facility. It is also worth mentioning that VLO uses LIFO inventory, meaning that more recent goods (and least expensive) will calculate lower COGS and thus a higher gross margin, something we saw in 2015 and which we elaborate upon further in this note.
Just to provide some context to these numbers, the closing price of VLO on March 12, 2020 is ~$18,000 M. The company’s operating income for 2019 was $3,836 M, with consensus expecting 2020 to be around $4,700 M (which will likely change drastically). Using 2015’s oil correction as a reference, when EBIT fell 40% from 2014 to 2015, we can assume that EBIT could see something around $2,300 M, implying that consensus would miss by ~50%. Net debt for Valero stands at $8,339 M, for a Net debt / EBIT ratio of 2.2x using 2019’s figures or 3.6x using the adjusted 2020 figure.
Capital returns: Buyback activity + dividends
The company has been aggressive in terms of returning capital to shareholders via buybacks and dividends, spending $2,614 M in 2017, $3,077 M in 2018 and $2,269 M in 2019. Just to provide some context on the previous oil crisis (2015 and 2016), these amounts were $3,686 M and $2,447 M, respectively, up from $1,850 M in 2014. Something we highlight from the previous crisis is the increased activity (almost up 100% YoY) in share repurchases during 2015 when the oil price fell ~30%.
Pension expenses
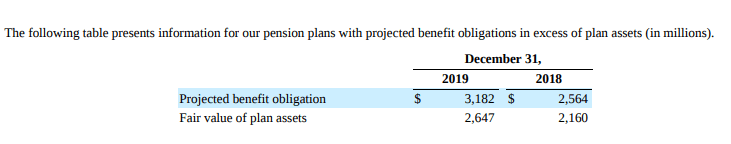
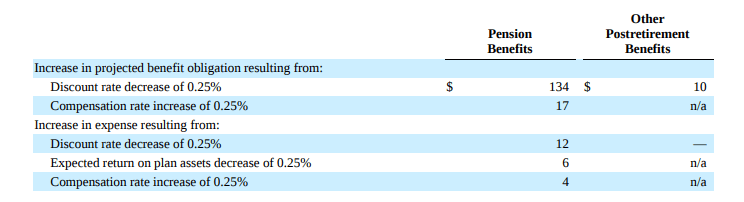
Another aspect that could worry investors is that VLO’s pension fund is currently underfunded, as the table below shows. Moreover, interest rate sensitivity shows that a decrease in interest rates provides some headwinds in terms of incremental expenses.
How to value VLO (DCF, Net reproduction value)
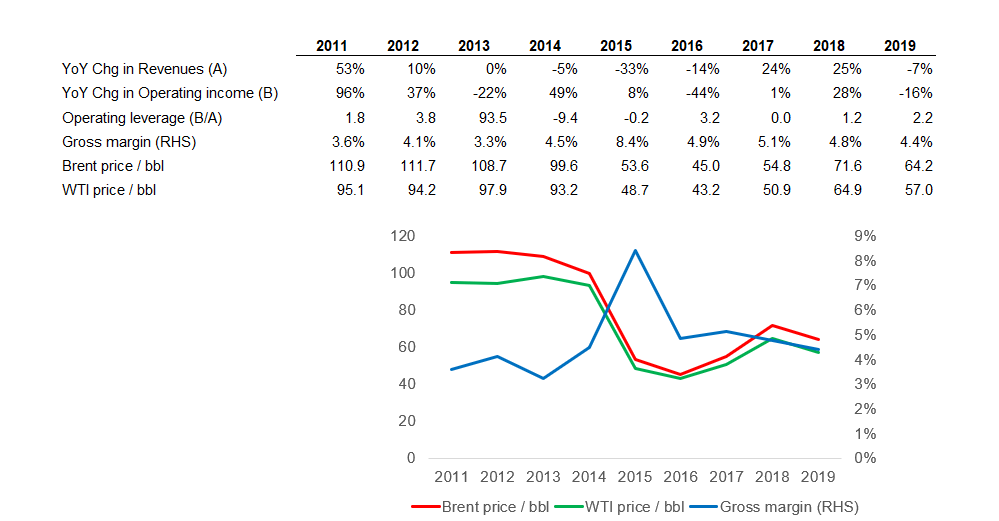
VLO currently has a market cap of ~$18B, for an estimated dividend yield of over 7%, which we honestly prefer to see as a nice to know item, but does not play a fundamental role in our thesis. We find three ways to reach an estimate of VLO’s value. The first one is a distressed DCF exercise in which we assume a drastic loss in FCF for years to come (pretty much in line with the 2015-16 oil crisis). The second one is the use of net reproduction value to provide a floor to the value. The third is a back-of-the-envelope calculation of a PE valuation. Before doing that, we highlight that VLO is likely to receive a positive boost in gross margin during 2020 as it will have lower COGS on LIFO inventory keeping. Moreover, the derivative exposure for 2020 is net short on oil prices. Back in 2015, when closing prices of Brent went from $99.6 per barrel to $53.6, VLO’s gross margin surged from 4.5% to 8.4%.
DCF
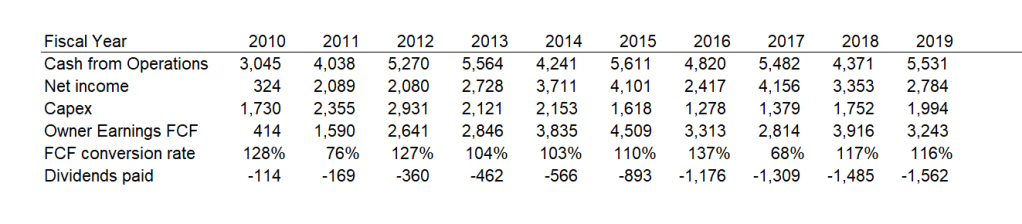
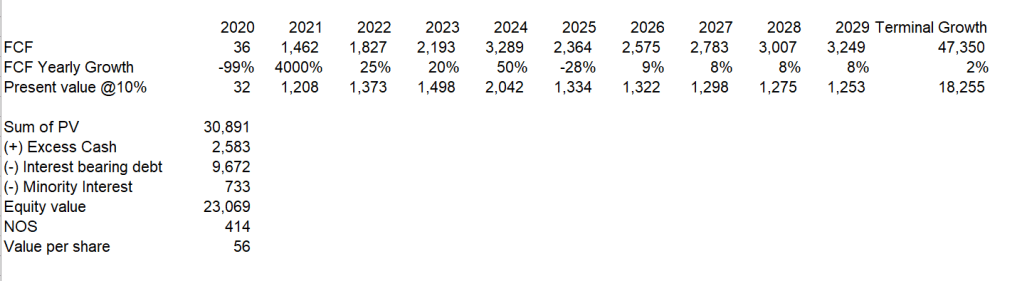
Even during times of stress, VLO has proved it has a strong FCF conversion capacity. For our exercise, we are using a near 100% decrease in FCF for 2020, with only marginal recoveries to previous levels going forward. Please note that the last 4 years average FCF is $3,322 M. Our DCF assumptions lead to a value of around $56 per share. Part of what makes us be particularly wary on 2020’s FCF is the current degree of operating leverage. Back in the end of 2015, operating leverage was actually negative, not positive as today. This does not make us pessimist, but we believe a steeper contraction than in the previous oil shock is not out of question.
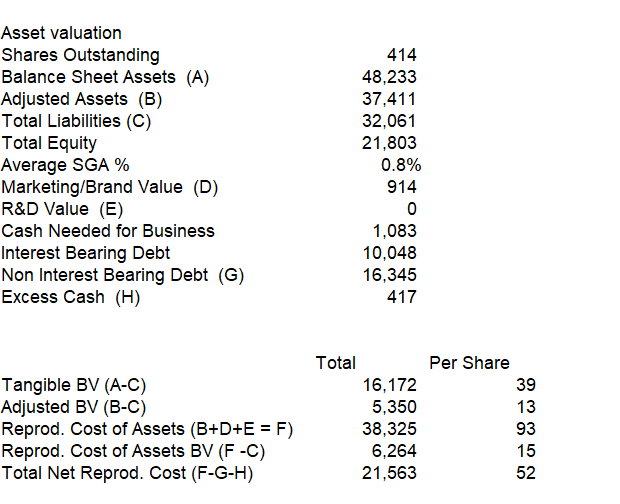
Net reproduction value
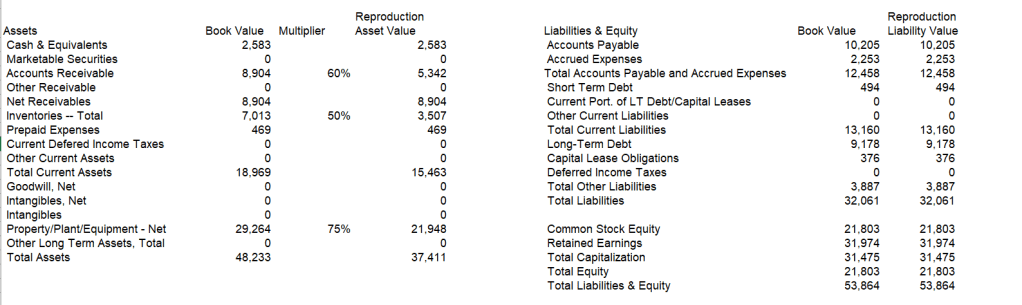
For this exercise we will discount the asset side of the balance sheet with a 40% to accounts receivable, a 50% to inventories and a 25% to PP&E. We then subtract net debt to have an idea of the reproduction cost of adjusted assets, which comes around $52 per share.
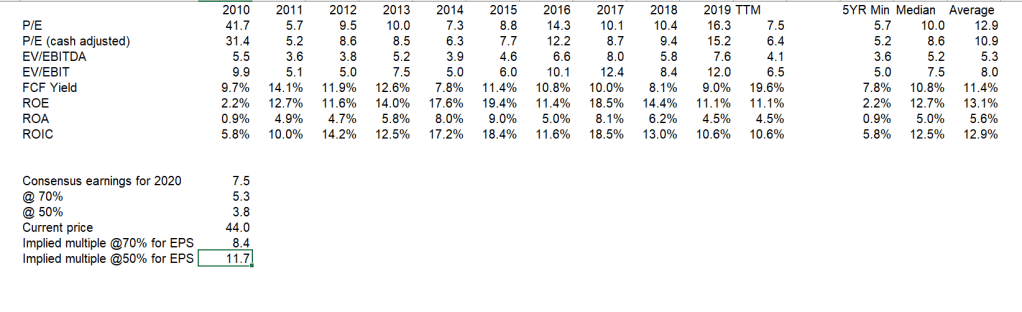
Multiples (back of the envelope)
As we mentioned before, doing a simple exercise with the P/E multiple, we can argue that the current 7.5x is very close to 2014 lows, only surpassed by 2011’s 5.7x. Assuming a 25% and 50% discount to 2020E EPS from consensus, we have some margin of safety vs. history. If we use the median PE multiple for 2020E earnings at a 30% discount, we get an estimated price of $53, or $38 using a 50% discount, which we consider would be a floor.
To conclude, VLO will have funding sources available to make it through 2020 without further capital injections. Moreover, contractual obligations and maturities for 2021 remain low as well. Looking at the valuation, we conclude that the company’s value per share ranges from $52 to $56 under very conservative estimates, representing close to a ~20% ETR with limited downside (~15%) at current prices.
