In one of his recent interviews, (link below) Ray Dalio from Bridgewater Associates describes his hypothesis on the current economic slowdown and how it could play out in the future. Trying to look for more data, we dove into Principles for Navigating Big Debt Crises, Dalio’s book on the subject.
Gathering information from 48 depressions, defined as real GDP contractions of at least 3%, he categorizes depressions in two categories: deflationary (21) and inflationary (27). Dalio argues that we are currently facing a deflationary one, so we will focus our attention in that category for the remainder of this post.
We will avoid the use of charts from Dalio’s book, which we encourage our readers to purchase for a way deeper analysis. We fill focus however, on the key takeaways and some base rates that should be useful to keep in mind for equity investors, as directly stated by Dalio.
- The extent of the current crisis will depend greatly on the willingness and ability of policy makers – Dalio mentions that this effectiveness will ultimately depend on 1) whether the debt is denonimated in the currency policy makers control and 2) whether they have influence over how creditors and debtors behave with each other.
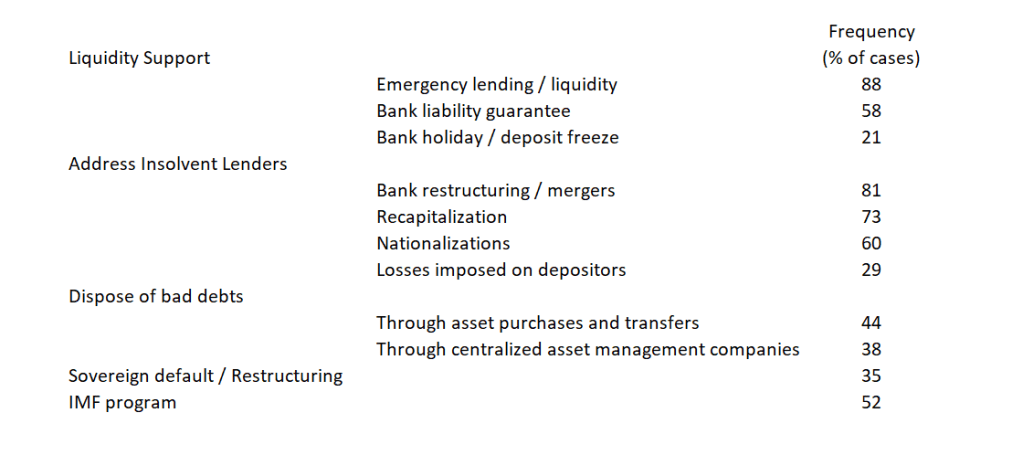
- Policy makers have four tools at their disposal – Dalio defines them as levers, or instruments that policy makers can pull to bring debt and debt service levels down relative to income and cash flow levels required to serve debt payments. These are: 1) austerity; 2) debt defaults/restructuring; 3) the central bank (CB) “printing money” and making purchases (or providing guarantees) and 4) transfers of money and credit from those who have more than they need to those who have less, (generally via taxes to income, property and consumption, although inheritance and wealth taxes can also be implemented). Since each lever has a different effect, it is in striking the right balance between them that can make or break a country. If combined appropriately, debt/income ratios decline at the same time that economic activity and financial asset prices improve, gradually bringing the nominal growth rate of incomes back above the nominal (debt) interest rate. Levers shift who benefits and who suffers, and over what amount of time.
- The characteristics of deflationary depressions: Policy makers respond to the initial economic contraction by lowering interest rates. But when interest rates reach 0%, that lever is ineffective. Debt restructuring and austerity dominate, without being balanced by adequate stimulation (especially money printing and currency depreciation). In this phase, debt burdens (debt and debt service as percentage of income) rise, because incomes fall faster than restructuring, debt paydowns reduce the debt stock, and many borrowers are required to rack up still more debts to cover those higher interest costs. These type of depressions generally occur in countries where most of the unsustainable debt was financed domestically in local currency, so that the eventual debt bust produces forced selling and defaults, but not currency or a balance of payments problem.
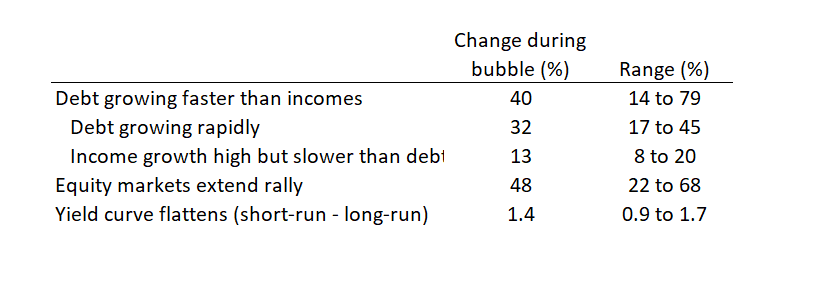
- Base rates for the bubble, how to detect them and a warning for early buyers: Seven signs of a bubble: 1) prices are high relative to traditional measures; 2) prices are discounting future rapid price appreciation from these high levels; 3) broad bullish sentiment; 4) purchases are being financed by high leverage; 5) buyers have made exceptionally extended forward purchases (e.g. built inventory, contracted for supplies) to speculate or protect themselves against future price gains; 6) new buyers have entered the market and 7) stimulative monetary policy threatens to inflate the bubble even more.
- The depression is real, not merely psychological: Some people mistakenly think that depressions are psychological, that investors move their money from riskier investments to safer ones because they are scared, and that the economy will be restored if they can only be coaxed into moving their money back into riskier investments. This is wrong for two reasons: 1) the process is driven by supply and demand of, and the relationships between, credit, money and goods and services and 2) debtors’ obligations to deliver money would be too large still relative to the money they are taking in. As this implies, a big part of the deleveraging process is people discovering that much of what they though of as their wealth was merely people’s promises to give them money. Now that those promises aren’t being kept, that wealth no longer exists.
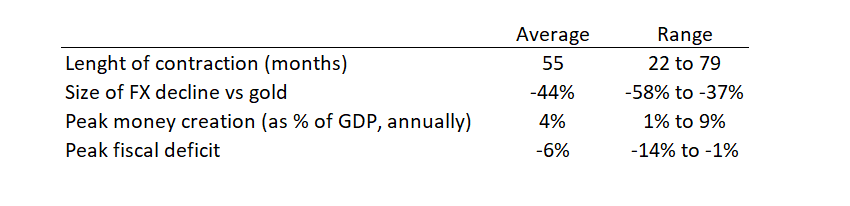
- Eventually all governments print money, which benefits gold – typically governments with gold, commodity or foreign FX pegged money systems are forced to have tighter monetary policies to protect the value of their currency than governments with fiat monetary systems. But eventually the debt contractions are so painful that they relent, break the link, and print. As seen below, the average drawdown of FX vs gold is about 44%, ranging from -58% to -37%.
- Should printing money bring higher inflation?: It will not if it offsets falling credit and the deflationary forces are balanced with this reflationary forces. What is happening is that credit destruction is being offset by money creation. If the balance between replacing credit and actively stimulating the economy is right, the effect is not inflationary.
- What does this mean today and how is the market stacking up against the base rate?: Taking the S&P500 as the equity proxy, we have a market high of 3386 on February 19, 2020. If we assume a 50% drawdown from those levels, which is the base rate for deflationary depressions, the resulting index level is 1693. The most recent close is 2790, after some days of recovery. This would still imply a ~40% potential decline on average equity prices.
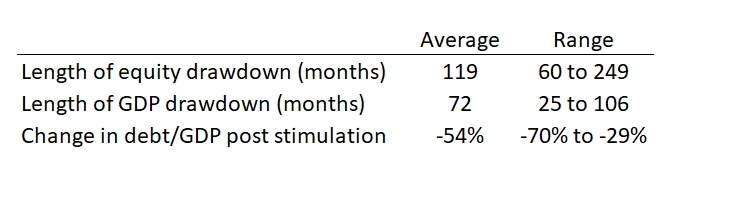
Given that depressions have lasted between 60 to 249 months (5 to almost 21 years) on average, this exercise is very good to put in context the recent recovery. While we are not in the forecasting business, we believe we could be in the very early stages of this development, with the future direction of the economy and equities more tilted towards further declines, based on the base rates. It typically takes roughly 5-10 years for the real economic activity to reach former highs, because it takes a very long time for investors to become comfortable taking the risk of upholding equities again. Moreover, as Dalio mentioned, “In the early stages of a bubble bursting, when stock prices fall and earnings have not yet declined, people mistakenly judge the decline to be a buying opportunity and find stocks cheap in relation to both past earnings and expected earnings, failing to account for the amount of decline in earnings that is likely to result from what is to come.“
Certainly not all asset classes, sectors and stocks should see similar results. Yet, we believe having an idea of how bad things can get is very useful to make the proper capital allocation decisions. As Howard Marks would say: You can’t predict. You can prepare. In the video, Dalio ponders on two key elements to navigate through depressions: the first one is diversification of assets, including alternative investments such as gold. In the second, Dalio discusses his idea that two type of companies generally thrive in these environments: 1) unleveraged companies with strong balance sheets and 2) the innovators, or companies that should benefit from new trends, demand and appeal.

2 thoughts on “On Depressions’ Base Rates”